
Abstract
Practitioners routinely read intraday shifts in index-option open interest as a forward-looking signal about where price is heading. This paper tests that reading directly. Using NIFTY 50 weekly index options, structural price breaks are identified algorithmically from spot data by a market-structure engine, each break is timestamped, and the surrounding options chain is reconstructed so that put- and call-side open interest can be aggregated in event time around the break.
Three questions are asked in sequence. First, whether open-interest repositioning around a break is associated with the direction of that break. Second, whether the association is already present before the break is observable in price, or whether it strengthens once the move is underway. Third, whether an open-interest-based signal delivers out-of-sample predictive information about breaks that have not yet happened, after controlling for recent price movement.
The association in the first test is strong and survives multiple-comparison correction across a large family of specifications. The event-time profile in the second test is more nuanced than a simple lead or lag: the association is already substantial some minutes before the break is confirmed and builds steadily through that window, but it reaches its maximum after confirmation rather than before it. The predictive test in the third does not replicate: a model fitted on a full in-sample year degrades to approximately chance discrimination on a held-out later period, and a deterministic trading rule built on the same signal does not produce a positive out-of-sample result.
The evidence is therefore consistent with open-interest repositioning acting as a state variable of an ongoing price-discovery process rather than as a leading indicator. Findings are specific to NIFTY 50 weekly options, the sample periods studied and the break-detection methodology used.
OI repositioning is strongly associated with break direction and that association is already building before the break is confirmed — but it peaks after confirmation, and it does not convert into a robust out-of-sample predictive edge.
Study design at a glance
In-sample coverage
55weekly expiries
Full calendar year, all four quarters, used for specification and estimation.
Out-of-sample window
4months
Held back entirely and evaluated once, after the in-sample analysis was frozen.
H1 specification family
30tests
Bonferroni correction applied across the entire family; the full table is reported in the paper's appendix.
H3 out-of-sample discrimination
≈ chance
Classifier AUC on the held-out period, against a 0.5 no-skill baseline. The in-sample specification did not replicate.
Research Question
Does intraday open-interest repositioning in NIFTY 50 weekly options provide information about the direction of structural price breaks before those breaks become apparent in price?
The question is deliberately narrow. It is not whether open interest carries information — a large literature and a great deal of practitioner experience say that it does. It is whether the specific, widely-used intraday reading of open-interest shifts around a structural break is anticipatory rather than coincident. Those two possibilities look almost identical in a chart drawn after the fact, and they have completely different consequences for anyone acting on the signal in real time.
Hypotheses
Each hypothesis was stated before it was tested, and each verdict is reported at the same volume — including the one that did not hold.
- H1Supported
OI shifts around a structural price break are statistically associated with the direction of that break.
The association is strong and a substantial share of the specification family survives Bonferroni correction at the family-wide threshold. Day-clustered and block-bootstrap inference is reported alongside trade-level statistics.
- H2Supported — in the reactive direction
The association between OI shifts and eventual break direction strengthens as the event approaches and develops.
The event-time profile is already positive well before the break and rises through the pre-break window, but it peaks after confirmation rather than ahead of it — which is why the verdict is stated in the reactive direction rather than as a clean anticipatory result. The paper describes this as consistent with dealer-hedging and repositioning behaviour, without asserting that mechanism as established.
- H3Not supported
An OI-based signal provides robust out-of-sample predictive information about structural price breaks after controlling for recent price movement.
In-sample discrimination is modest after confound correction and marginal under day-clustered inference. On the held-out period it degrades to approximately chance, and the deterministic trading rule does not produce a positive out-of-sample result.
Data
Instrument. NIFTY 50 index and NIFTY 50 weekly index options.
Break detection. Structural breaks are identified from spot data by a market-structure engine implementing break-of-structure and change-of-character logic, ported from a TradingView Pine Script v6 indicator so that the detection rule is fully specified and reproducible rather than discretionary.
Positioning measure. Put-side minus call-side open interest, aggregated across a strike band around the prevailing spot level, reconstructed from archived weekly options-chain snapshots and aligned to each break timestamp in event time.
Sample design. A full in-sample calendar year covering all four quarters and 55 weekly expiries, plus a genuinely held-out later period used only once, for the out-of-sample test. The out-of-sample window was not consulted during specification, feature construction or model selection.
Availability. The paper's disclosure statement offers the underlying data on reasonable request. Options-chain archives are licensed vendor data and are not redistributed here.
Methodology
Processing pipeline
Ingestion
NIFTY spot data
One-minute NIFTY 50 index data is loaded, checked for gaps and normalised to a single session-aware time base. Nothing downstream is allowed to silently interpolate.
The analysis runs as a single deterministic pipeline; every figure in the paper is traceable to the code that produced it.
1 — Spot ingestion. One-minute NIFTY 50 index data is loaded and cleaned.
2 — Market-structure engine. Break-of-structure and change-of-character events are detected mechanically from swing structure, with the significance threshold applied as a fixed parameter rather than chosen per-episode.
3 — Event timestamping. Each detected break becomes an event with a precise timestamp, a direction, and a session context.
4 — Options-chain reconstruction. For each event, the weekly options chain is reconstructed around the event time and open interest is read at each relevant strike.
5 — PE/CE aggregation. Put- and call-side open interest is aggregated across a strike band to a single differential series per event.
6 — H1 association tests. The relationship between the open-interest shift and break direction is estimated across a family of specifications, with a Bonferroni correction applied across the full family rather than to the best-performing member.
7 — H2 event-time analysis. The same association is re-estimated at successive offsets before and after the break, producing a profile that shows when the relationship exists rather than only whether it does.
8 — H3 predictive model. A classifier is fitted to forecast the direction of a break that has not yet been confirmed, using only information available at decision time and controlling for recent price movement — the obvious confound, since a break is by construction preceded by a move.
9 — Out-of-sample validation. The fitted specification and a fully deterministic trading rule derived from it are evaluated once on the held-out period.
10 — Robustness. Strike band, open-interest observation window and the quiet-period threshold are each swept across a range of values to confirm that the conclusions are not an artefact of one parameter choice.
Results
H1 — Association is present and strong. The relationship between open-interest repositioning around a break and the direction of that break is statistically strong, and a substantial share of the specification family survives Bonferroni correction at the family-wide threshold. Inference is reported both at trade level and with day-clustered and block-bootstrap standard errors, because intraday events on the same session are not independent.
H2 — The association builds before confirmation but peaks after it. Estimating the same relationship at successive event-time offsets produces a profile that is already meaningfully positive in the pre-break window and rises steadily through it, crosses confirmation still rising, and reaches its maximum a few minutes afterwards before easing slightly. Two detection thresholds give almost identical curves.
This is the pivotal result, and it is worth stating carefully. There is pre-break association — the profile is not flat and then suddenly alive. What the shape rules out is the reading that would matter most to someone acting on it: the signal is not at its most informative before the move, and the pre-break portion is not, on its own, enough to predict a break that has not happened. H3 tests that directly.
H3 — Prediction does not survive out-of-sample testing. After correcting for the recent-price-movement confound, the classifier's in-sample discrimination is modest. On the held-out period it degrades to approximately chance. The deterministic trading rule built from the same signal is marginal in-sample under day-clustered inference and does not produce a positive out-of-sample result.
Exact coefficients, test statistics, survivor counts and the full thirty-test appendix table are reported in the working paper.
Figure 2
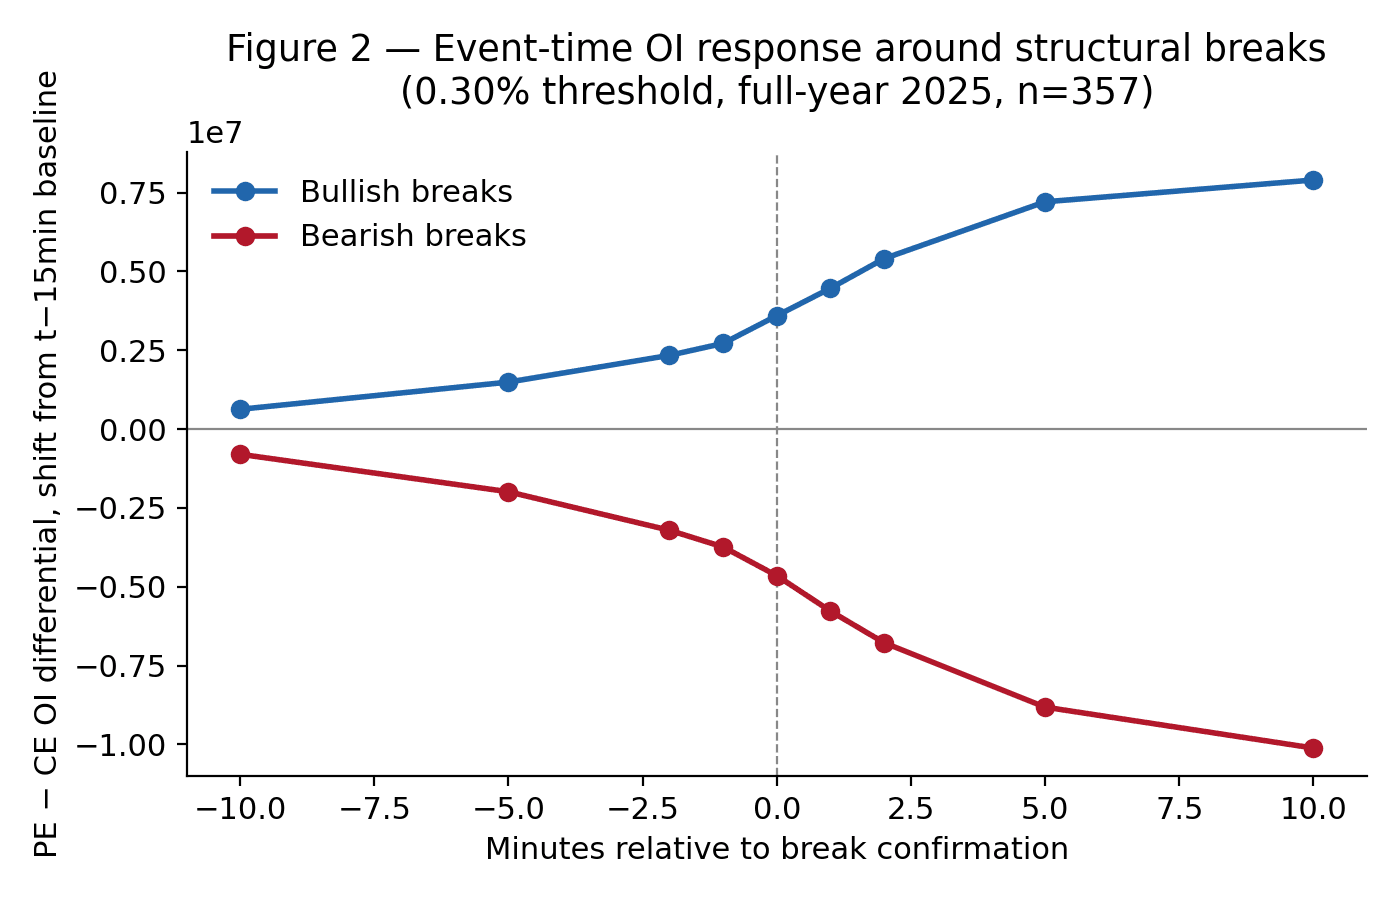
Put-minus-call open-interest differential in event time, measured as a shift from the t−15 minute baseline and averaged separately over bullish and bearish breaks. 0.30% threshold, full-year 2025, n = 357. Figure 3
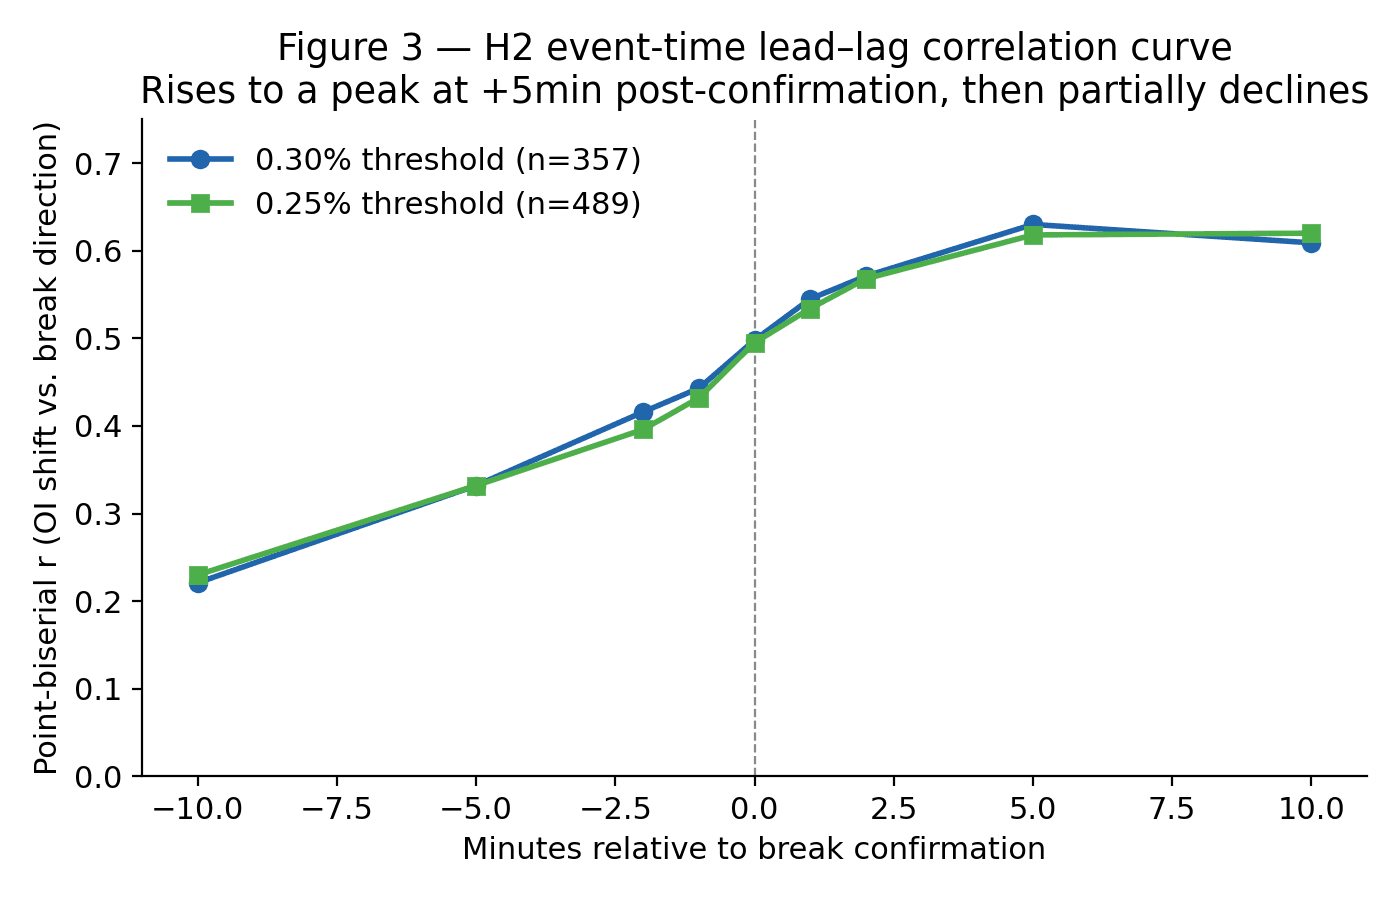
Point-biserial correlation between the open-interest shift and break direction, estimated at successive event-time offsets, at two detection thresholds. The curve rises through the pre-break window, peaks five minutes after confirmation, and then declines slightly. Figure 4
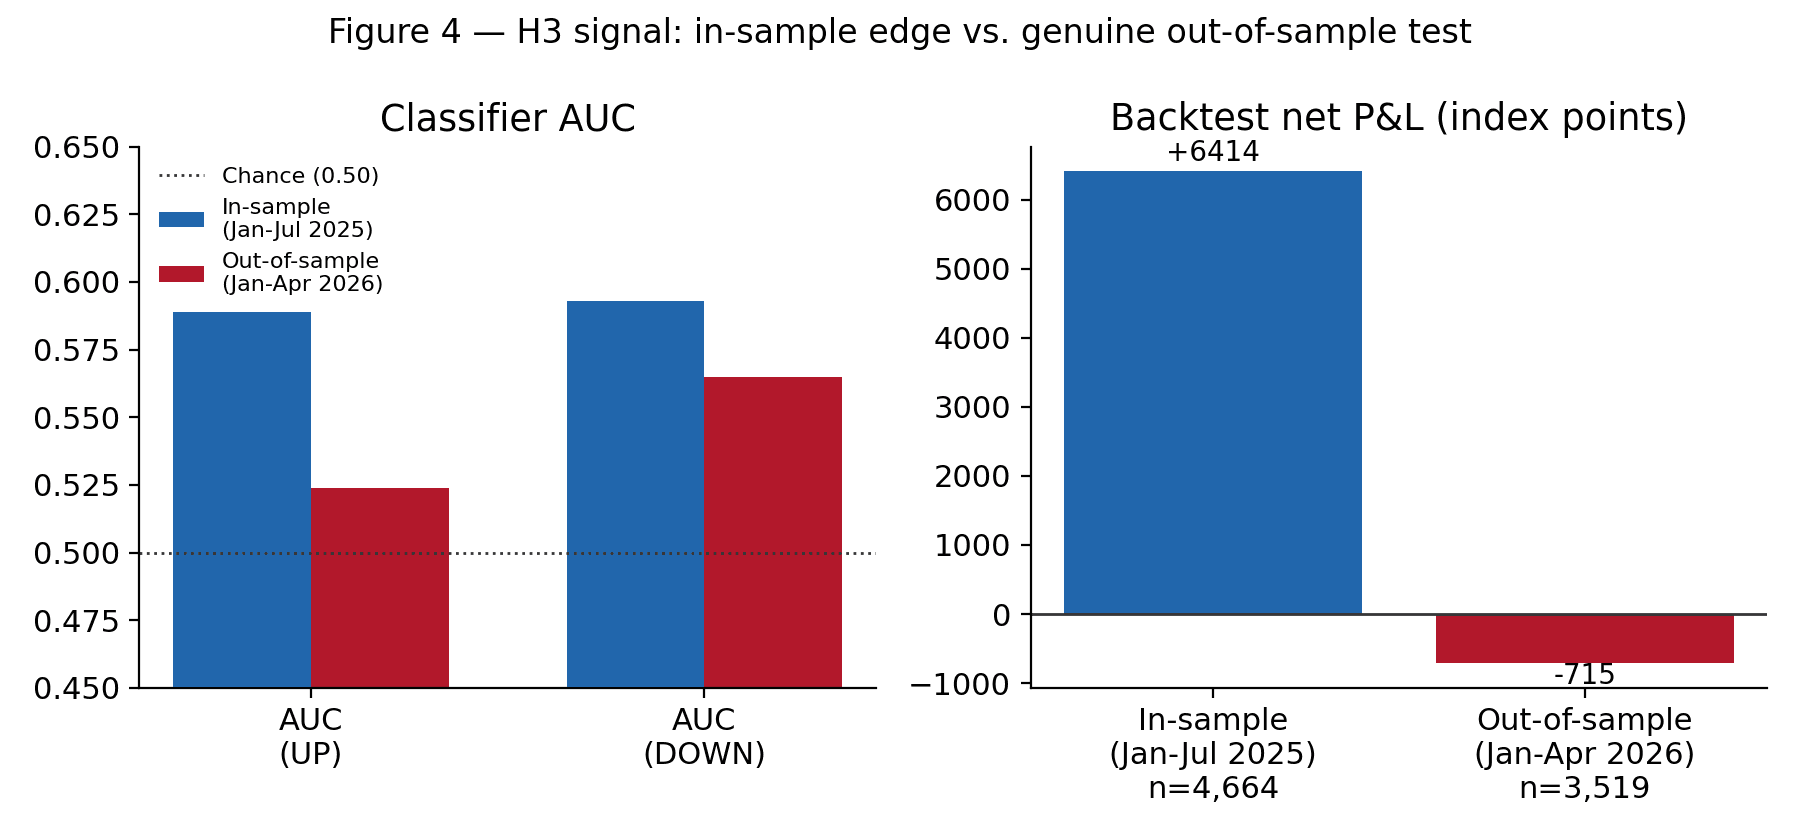
The H3 signal in sample against a genuine out-of-sample test. Left: classifier discrimination for up and down breaks, against the 0.5 no-skill baseline. Right: net backtest profit and loss in index points. In-sample Jan–Jul 2025 (n = 4,664); out-of-sample Jan–Apr 2026 (n = 3,519).
Robustness
Each conclusion was re-estimated across parameter sweeps rather than reported at a single tuned setting.
- Strike band. Widening and narrowing the band around spot does not change the sign or the qualitative strength of the association.
- Open-interest window. Varying the observation window around the event timestamp leaves the event-time profile intact.
- Quiet-period threshold. Sweeping the threshold that defines a quiet pre-break regime across the interquartile range of its distribution does not rescue the predictive result.
- Inference. Trade-level statistics are reported alongside day-clustered and block-bootstrap alternatives. Where the two disagree, the more conservative figure is the one the paper's conclusions rest on.
- Multiple comparisons. The Bonferroni threshold is applied across the entire family of tests run, and the family is disclosed in full in the appendix.
- Pre-specified versus exploratory. The paper states explicitly which analyses were specified before looking at the data and which were exploratory.
Out-of-Sample Evaluation
The out-of-sample period was held back deliberately and evaluated once.
An earlier version of the analysis contained a predictive specification whose in-sample discrimination was modest but non-trivial after confound correction. On the true out-of-sample window that discrimination decayed to approximately chance, and the specification was discarded rather than re-tuned. The reactive finding, by contrast, replicated: it survived multiple-comparison correction and an independent from-scratch replication of the original study's own tests.
This asymmetry is the paper's most useful contribution. Both findings came from the same pipeline, the same data and the same author. One survived contact with unseen data and one did not, and the difference between them is exactly the difference between description and prediction.
Interpretation
The evidence supports interpreting open-interest repositioning primarily as a state variable of an ongoing price-discovery process — a confirmation or context signal associated with price moves already underway — rather than as a leading indicator for moves not yet observed in price.
This is a statement about a specific measurement in a specific market, not a verdict on open interest as a concept. The results say nothing about open interest at longer horizons, at other strikes or expiries, in other instruments, or when combined with information this study did not use. They say that in NIFTY 50 weekly options, over the sample periods studied, using the break-detection methodology described, the intraday repositioning signal is at its most informative once the move is underway rather than before it — and that the portion of it that does arrive early is not enough to predict a break out of sample.
The practical implication follows directly. A signal that peaks with a move is genuinely useful for understanding what is happening and for contextualising a position. The pre-break association is real, and it is tempting to read it as an edge — but it did not survive the out-of-sample test, and treating it as an edge anyway is exactly the error that test is designed to catch.
Limitations
- One instrument, one contract type. All results are specific to NIFTY 50 weekly index options. Monthly expiries, single-stock options and other indices are untested here.
- One break definition. Structural breaks are defined by a specific break-of-structure and change-of-character rule at a fixed significance threshold. Other reasonable definitions exist and could produce different event sets.
- Sample length. A single in-sample year and a several-month out-of-sample window is enough to reject a strong predictive claim, and not enough to characterise regime dependence.
- Snapshot granularity. Open interest is read from archived chain snapshots; intra-snapshot dynamics are invisible to the analysis.
- Band and window robustness coverage. The band and window sweeps were run at a single break-significance threshold rather than at every threshold tested elsewhere in the paper.
- No pipeline schematic in the manuscript. The processing pipeline is described in prose and in code, and is diagrammed on this site rather than in the PDF.
- Negative result, not proof of absence. Failing to find robust out-of-sample predictability is evidence against this particular signal specification. It is not proof that no open-interest-based predictive signal exists.
Conclusion
Intraday open-interest repositioning around structural price breaks in NIFTY 50 weekly options is strongly and reliably associated with the direction of the break. The association is largely coincident: it emerges as the break is confirmed rather than before it. A predictive specification built on the same signal, with the obvious price-movement confound controlled, does not demonstrate robust out-of-sample performance, and a deterministic rule built from it does not produce a positive out-of-sample result.
The honest reading is that this signal describes price discovery rather than anticipating it. That is a useful thing to know precisely because the two are so easily confused in retrospect.
Downloads & Replication
Where a link is not yet available it is shown as unavailable rather than pointed somewhere plausible.
- Code repository
- https://github.com/subbu-31/nifty-oi-repositioning
- Replication guide
- https://github.com/subbu-31/nifty-oi-repositioning#readme
Questions about data, method or replication are welcome — see the contact page. The general approach to reproducibility is described under methodology.
Citation
Suggested citation
Subhash Sadacharam (2026). Open Interest Repositioning around Intraday Price-structure Breaks: Evidence from NIFTY 50 Index Options. Working Paper. Version v17. Precision Capital Academy LLP. https://papers.ssrn.com/sol3/papers.cfm?abstract_id=7394780 https://doi.org/10.2139/ssrn.7394780
DOI: 10.2139/ssrn.7394780