
Abstract
“Buy Today, Sell Tomorrow” (BTST) — buy near the close, hold overnight, sell at the open — is common folklore among Indian retail and quant traders. This paper takes that folklore seriously and tests it directly. Stated at the level of precision it can support: in a selected, partially point-in-time F&O-eligible Indian equity panel, close-to-open returns are positive and broadly distributed; straightforward long-only attempts to monetize the pattern do not appear robust after realistic implementation constraints. Using six years of one-minute data (2020–2025) on 184 NSE stocks that were F&O-eligible when this panel was built, we find the close-to-open (“overnight”) return earns +17.97 basis points per day pooled. Under two-way (stock × date) cluster-robust inference, the conservative standard this paper relies on throughout, this gives a t-statistic of 9.48; a naive per-observation Newey-West HAC estimate, which does not account for cross-sectional correlation across stocks on the same day, gives a considerably larger t-statistic of 81.04, but we do not treat that larger figure as the paper's primary evidence. The premium is positive for all 184 sampled stocks, with the per-stock mean overnight return ranging from 2.50 bps/day (HDFCBANK) to 36.56 bps/day (HINDCOPPER) and a median of 18.23 bps/day — stable in every calendar year from 2020 to 2025, and robust to value-weighting, winsorization, liquidity screening, and a point-in-time correction for stocks that joined the F&O segment mid-sample (16.95 bps corrected; two-way clustered t=10.05, alongside a supplementary HAC t=80.66). A calendar-time block bootstrap confirms it (95% CI [12.95, 22.16] bps). Two precise, deliberately un-blurred nuances qualify this: roughly a third to a half of the raw premium is market-beta exposure (unit-beta-adjusted 6.93 bps/day; rolling-beta-adjusted 9.13 bps/day, using a corrected beta estimator described below), while the cross-sectional ranking skill that identifies which stocks will outperform survives factor neutralization far better — about 87% of a persistence ranking's edge over random selection (9.24 to 8.09 bps/day) remains after removing beta, liquidity, and volatility jointly. This decomposition, not the execution analysis that follows, is this paper's primary contribution. All risk adjustment in this paper is against a single NIFTY-beta factor; it is not a claim of a risk-adjusted excess return net of a fuller set of standard equity risk factors (size, value, momentum, quality), which this paper does not construct.
BTST folklore is silent on execution, however, and this paper asks simply whether any harvesting method delivers a return that is both economically material and statistically robust net of realistic costs and correct real-time implementability, rather than applying a single bright-line pass/fail threshold. By that standard, no long-only strategy tested here is robust after realistic implementation constraints. Buying every eligible stock every night is catastrophic under realistic position sizing and fees (−63.2% CAGR out-of-sample). A model-conditioned improvement — forced nightly liquidation of a top-decile selection, chosen by a simple 60-day trailing-mean persistence rule that a seven-feature LightGBM model and a linear ridge regression both fail to beat on identical cross-validation folds — does much better but still lands at best near breakeven (−0.5% CAGR retail, −9.5% entity, at ₹20,00,000 starting capital), and 0 of 30 cost-sensitivity parameter combinations we tested are both net-positive and statistically significant. A third discipline (“Hold-Through”) initially appeared to solve the problem convincingly, but this rested on a look-ahead bug in the backtest, caught only through a simulated adversarial referee review and corrected (summarized in Section 5.5; full account in Appendix A). Once corrected, Hold-Through returns −18.1% CAGR (retail) and −22.7% (entity) on the original discovery window and −25.1% on the 2026 window — worse than forced liquidation in every case, negative across every capital level from ₹5,00,000 to ₹1,00,00,000, every cost scenario tested, and both windows.
The close-to-open premium is real, large and pervasive in this panel (+17.97 bps/day, two-way clustered t = 9.48), and an ex-ante ranking spread replicates on 2026 data — but every long-only harvesting method tested fails once implemented correctly and costed realistically.
Study design at a glance
Pooled overnight premium
+17.97bps/day
184 stocks, 2020–2025; two-way clustered t = 9.48 (primary inference).
Stocks with a positive premium
184 of 184
Per-stock means from 2.50 to 36.56 bps/day; median 18.23.
2026 ex-ante spread
11.13bps/day
Top-minus-bottom decile on genuine 2026 data, HAC t = 4.17 — the only forward-validated result.
Best long-only harvest
−0.5%CAGR
Forced nightly liquidation of the top decile, ₹20,00,000 retail, fee-only; 0 of 30 sensitivity cells significant.
Research Question
“Buy Today, Sell Tomorrow” is a widely repeated piece of Indian market folklore: buy near the close, hold overnight, sell at the open. The paper asks three questions in order. Is the underlying belief about overnight returns true in this market? If it is, does it survive the scrutiny a skeptical referee would apply? And does any increasingly sophisticated way of collecting it survive realistic 2026 Indian trading costs and — just as importantly — correct real-time implementability?
The primary contribution is the first: establishing that the close-to-open premium exists in this panel and decomposing how much of it is market beta and how much is cross-sectional ranking skill. The execution analysis is secondary and cautionary.
Hypotheses
Each hypothesis was stated before it was tested, and each verdict is reported at the same volume — including the one that did not hold.
- H1Supported
Close-to-open returns in this panel are positive and robust to dependence-robust inference, market adjustment and a point-in-time universe correction.
+17.97 bps/day pooled, two-way clustered t = 9.48; positive in all 184 stocks and every year 2020–2025; 16.95 bps after the point-in-time correction. Roughly a third to a half of the level is market beta.
- H2Supported
An ex-ante cross-sectional ranking predicts which stocks earn more overnight, out of sample.
The top-minus-bottom-decile spread, ranked only on information available before the open, replicates on genuine 2026 data: 11.13 bps/day, HAC t = 4.17. This is the paper's only forward-validated result.
- H3Not supported
A long-only method of harvesting the premium is economically material and statistically robust after correct real-time implementation and realistic costs.
Blanket capture −63.2% CAGR; forced liquidation −0.5% (retail) with 0 of 30 sensitivity cells significant; corrected Hold-Through −18.1% to −25.1%. An earlier positive Hold-Through result was a look-ahead bug.
Data
Universe. 189 NSE-listed, F&O-eligible stocks chosen because F&O eligibility identifies a liquid, currently investable universe. One-minute OHLCV data from 1 January 2020 to 31 December 2025 was obtained for 185; one recent listing was dropped for insufficient history. The working panel is 184 stocks and 274,263 stock-days.
Returns. Overnight = ln(open(t)/close(t−1)); intraday = ln(close(t)/open(t)), using the continuous session's first and last one-minute bars rather than auction prices, which one-minute data does not carry.
Corporate actions. Days with an absolute overnight return above 8% are cross-checked against NSE's corporate-actions record; 29 of 603 flags were confirmed actions and excluded.
Periods. In-sample 2020–2023 (182,634 stock-days), out-of-sample 2024–2025 (91,629), and a separate 2026 extension (1 January – 11 September 2026; 31,832 stock-days, 173 trading days) pulled after the model, hyperparameters and execution definitions were frozen.
Methodology
Inference. The primary standard is two-way (stock × date) cluster-robust inference, because 184 stocks moving together on one date are not 184 independent observations. A naive per-observation HAC t-statistic is reported only as a supplementary figure. A calendar-time block bootstrap (2,000 resamples, 10-day blocks) and per-stock Wilcoxon tests are used as checks.
Market adjustment. A unit-beta adjustment subtracts NIFTY 50's own overnight return; a more precise version uses each stock's rolling 120-day beta from strictly trailing data. Ranking skill is tested by residualising the persistence signal against beta, liquidity and realised volatility jointly.
Selection rule. Stocks are ranked by a simple 60-day trailing mean of their own overnight return. A seven-feature LightGBM model and a ridge regression were tested against it on identical purged, embargoed walk-forward folds.
Costs. Fees are built from Zerodha's published 2026 rate card, separately for individual and non-individual accounts; market impact uses a square-root model calibrated two ways; bid-ask spread is estimated three ways.
Ex-ante versus ex-post. The paper separates a ranking formed before the fact (a predictive test) from any statistic that conditions on whether a stock is also selected the next day (descriptive only). Only the former is described as forward validation.
Results
The premium is real. Pooled overnight return +17.97 bps/day; two-way clustered t = 9.48. In-sample +19.60 bps/day, out-of-sample +14.73; the intraday leg is negative in both (−11.75 and −10.96). Block-bootstrap 95% CI [12.95, 22.16] bps.
It is pervasive. All 184 stocks have a positive mean overnight return (2.50 to 36.56 bps/day, median 18.23), and Wilcoxon tests are significant in 182 of 184. It is positive and significant in every year from 2020 to 2025.
Beta versus ranking skill. A unit-beta adjustment reduces the premium to 6.93 bps/day and a rolling-beta adjustment to 9.13 — roughly a third to a half is market-beta exposure. Ranking skill survives much better: the persistence ranking's edge over random selection goes from 9.24 to 8.09 bps/day after neutralising beta, liquidity and volatility, an 87% retention.
Persistence beats machine learning. Mean information coefficient 0.1026 for persistence against 0.0821 for LightGBM on identical folds; persistence wins 4 of 5 folds. A ridge regression is slightly better than persistence; nonlinearity does not help.
Harvesting fails. Buying every eligible stock every night: −63.2% CAGR out-of-sample. Forced nightly liquidation of the top decile at ₹20,00,000: −0.5% CAGR (retail) and −9.5% (non-individual), with 0 of 30 cost-sensitivity combinations both net-positive and significant. The corrected Hold-Through discipline: −18.1% (retail) and −22.7% (non-individual) on the discovery window and −25.1% on 2026.
Figure 1
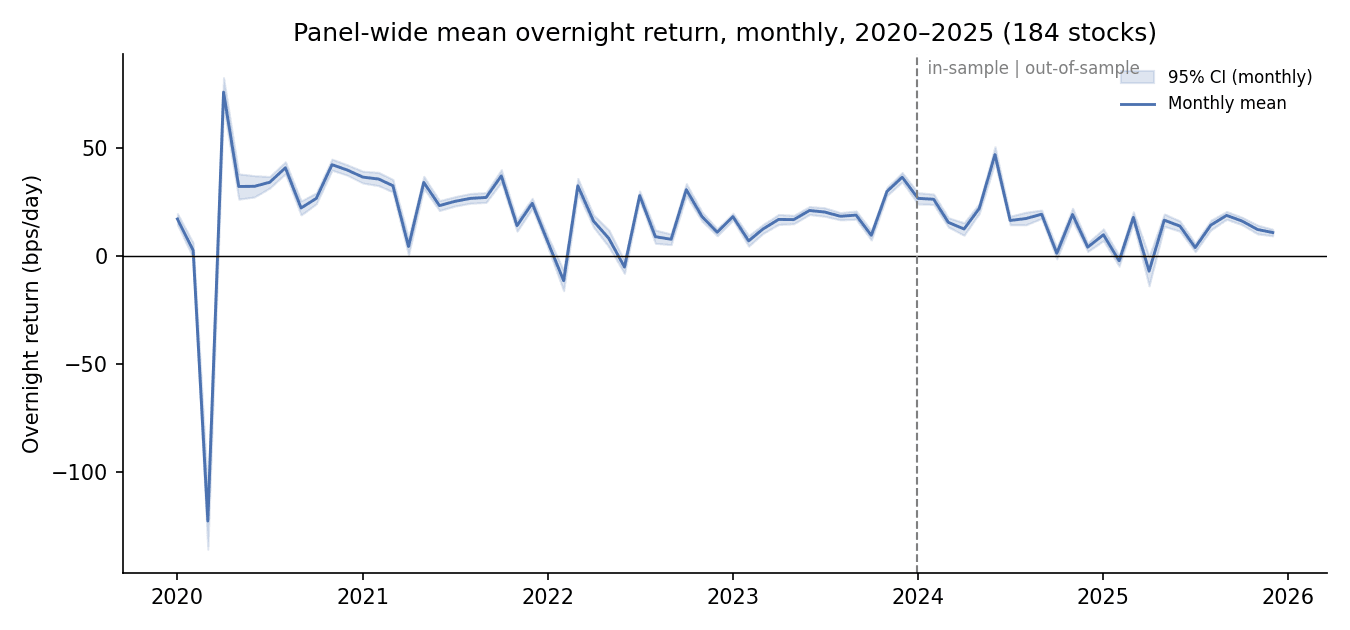
Panel-wide mean overnight return by month, 2020–2025 (184 stocks), with a 95% confidence band. The dashed line marks the in-sample/out-of-sample boundary.
Robustness
- Alternative constructions. Value-weighting gives 20.20 bps, winsorising 18.97 bps and excluding the least liquid quartile 17.58 bps — none moves the estimate by more than about 2 bps.
- Point-in-time correction. 61 stocks joined the F&O segment mid-sample. Using only genuinely eligible stock-days moves the headline from 17.97 to 16.95 bps/day (two-way clustered t = 10.05).
- Corporate-action window. Varying the matching window from 0 to 5 days moves the panel mean by at most 0.12 bps.
- Regimes. In the February–June 2020 COVID window the overnight mean is indistinguishable from zero. The large up-day/down-day asymmetry is essentially all market beta.
- Costs and scale. No market-impact assumption or spread estimator rescues the corrected Hold-Through result; every cost layer only deepens the loss.
- Internal audit. A five-track, author-conducted audit checked for look-ahead timing, compounding, statistical formulas, data integrity and spread formulas. It found the Hold-Through bug, a latent merge bug that never affected a reported number, and a small beta-estimator inconsistency, since corrected.
Out-of-Sample Evaluation
The paper is explicit about which results count as forward validation.
The one forward-validated result. A same-day top-minus-bottom-decile spread, ranked only on information available before the day's open, replicates on genuine 2026 data the model never saw: 11.13 bps/day (HAC t = 4.17), against 14.90 bps/day (t = 9.78) in the original window — a later-sample replication under a frozen specification.
A false positive, caught and corrected. A “Hold-Through” discipline first appeared to return +75.0% CAGR on the discovery window and +41.2% on 2026. A deliberately adversarial, referee-style review of its information timing found it decided whether to hold a position through the session using the next day's selection — which is not knowable until that day's close. Corrected, it is negative at every capital level, cost scenario and window tested.
Not a forward test. A bottom-decile intraday short overlay shows a positive point estimate (+2.4% CAGR discovery, +12.2% 2026) but is not distinguishable from zero (HAC t = 0.40 and 0.83; bootstrap intervals span zero). Its scripts were written after the 2026 data existed, so its 2026 figure is in-sample relative to when the code was written.
Interpretation
The folklore is right about where the return lives: essentially all of this panel's long-run positive return is overnight-sourced, and the overnight return is real by every dependence-robust standard applied. It is wrong that the return is straightforwardly collectable. The paper's most promising harvesting method failed a more basic test — correct real-time implementability — before transaction costs became the deciding factor at all.
The methodological lesson is the paper's second contribution: a stress-test battery passed on the wrong mechanic proves nothing about whether that mechanic can be traded in real time. Catching that requires adversarial scrutiny of exactly what information is available at every decision point.
This is research, not investment advice.
Limitations
- One market, one panel. Results are specific to 184 stocks that were F&O-eligible when the panel was built — not a claim about Indian equities generally.
- Partially point-in-time. The eligibility correction fixes entry-date bias for 61 stocks only; former constituents, four unretrieved symbols, and delistings or suspensions are not reconstructed.
- Short forward window. The 2026 extension covers roughly nine months.
- Costs are modelled. Fee, impact and spread estimates are proxies, not exchange-verified fills.
- Single risk factor. Risk adjustment uses NIFTY beta only, not size, value, momentum or quality factors.
- Prices are continuous-session bars, not auction prints; magnitudes move by about 2 bps across 1-, 5- and 15-minute definitions.
- No multiple-testing correction. Many specifications were explored and no formal correction is applied to individual results.
- Not externally validated. The audit was internal. Public code and data, a data dictionary, checksums, a published environment and automated leakage tests do not yet exist.
Conclusion
In this panel, close-to-open returns are positive and broadly distributed, and the premium is real and statistically overwhelming under a conservative two-way clustered standard. A genuinely ex-ante ranking spread replicates on previously unobserved 2026 data. But every harvesting method tested — blanket capture, forced liquidation and the corrected Hold-Through discipline, under any cost assumption, capital level or parameter choice — fails to deliver a return that is both economically material and statistically robust, and the one component with a positive point estimate is not distinguishable from zero. A specific, initially convincing look-ahead bug very nearly produced the opposite conclusion; how it was caught is reported in full because it may be as useful to others as the result itself.
References
- [1]Cooper, M. J., Cliff, M. T., & Gulen, H. (2008). Return Differences between Trading and Non-Trading Hours: Like Night and Day. Working Paper, University of Utah. Link
- [2]Berkman, H., Koch, P. D., Tuttle, L., & Zhang, Y. J. (2012). Paying Attention: Overnight Returns and the Hidden Cost of Buying at the Open. Journal of Financial and Quantitative Analysis, 47(4), 715–741. Link
- [3]Lou, D., Polk, C., & Skouras, S. (2019). A tug of war: Overnight versus intraday expected returns. Journal of Financial Economics, 134(1), 192–213. Link
- [4]Akbas, F., Boehmer, E., Jiang, C., & Koch, P. D. (2022). Overnight returns, daytime reversals, and future stock returns. Journal of Financial Economics, 145(3), 850–875. Link
- [5]Chui, A., Ranganathan, K., Rohit, A., & Veeraraghavan, M. (2023). Momentum, reversals and liquidity: Indian evidence. Pacific-Basin Finance Journal, 82, 102193. Link
- [6]Heston, S. L., Korajczyk, R. A., & Sadka, R. (2010). Intraday Patterns in the Cross-Section of Stock Returns. The Journal of Finance, 65(4), 1369–1407. Link
- [7]Gu, S., Kelly, B., & Xiu, D. (2020). Empirical Asset Pricing via Machine Learning. Review of Financial Studies, 33(5), 2223–2273. Link
- [8]Sampath, A., & Gopalaswamy, A. K. (2020). Intraday Variability and Trading Volume: Evidence from National Stock Exchange. Journal of Emerging Market Finance, 19(3), 271–295. Link
- [9]Bhanu, A., Nath, G. C., & Patnaik, T. (2024). Unlocking Liquidity through Shortened Settlement Cycle: Empirical Evidence from India. Economics Letters, 239, 111736. Link
- [10]Shleifer, A., & Vishny, R. W. (1997). The Limits of Arbitrage. The Journal of Finance, 52(1), 35–55. Link
- [11]Cameron, A. C., Gelbach, J. B., & Miller, D. L. (2011). Robust Inference With Multiway Clustering. Journal of Business & Economic Statistics, 29(2), 238–249. Link
- [12]Corwin, S. A., & Schultz, P. (2012). A Simple Way to Estimate Bid-Ask Spreads from Daily High and Low Prices. The Journal of Finance, 67(2), 719–760. Link
- [13]Roll, R. (1984). A Simple Implicit Measure of the Effective Bid-Ask Spread in an Efficient Market. The Journal of Finance, 39(4), 1127–1139. Link
- [14]Haghani, V., Ragulin, S., & Dewey, D. Night Moves: Overnight vs. Intraday Stock Returns. Working paper / practitioner research, cited here for its documentation of individual-stock overnight drift in developed markets.
- [15]Kamath, S. (2026). Overnight and Intraday Returns in Indian Index Futures. Working paper. Available at SSRN.
- [16]Zaremba, A., & Nikorowski, J. (2018). Trading costs, market anomalies and the efficiency of emerging market stocks: a note. Economics and Business Letters / related working paper on frictions and emerging-market anomaly survival.
- [17]Chen, C.-H., et al. (2023). Intraday and overnight momentum in an emerging market. Pacific-Basin Finance Journal (Taiwan IMOM/OMOM decomposition).
- [18]Bogousslavsky, V. (2021). The cross-section of intraday and overnight returns. Journal of Financial Economics, 141(1), 172–194.
- [19]Novy-Marx, R., & Velikov, M. (2016). A Taxonomy of Anomalies and Their Trading Costs. Review of Financial Studies, 29(1), 104–147. Link
- [20]Daniel, K., & Moskowitz, T. J. (2016). Momentum crashes. Journal of Financial Economics, 122(2), 221–247. Link
- [21]Zerodha Broking Ltd. Charges — brokerage, taxes and fees on trading and investing. https://zerodha.com/charges/ (accessed 2026; rates as published, subject to change).
- [22]NSE Impact Cost methodology and published Nifty 50 constituent impact-cost benchmarks, cited as the institutional anchor for the market-impact calibration in Section 5.6.
- [23]NSE, BSE, CDSL and NSDL joint press releases and circulars on the phased transition to T+1 settlement (2021–2023), cited as institutional/regulatory background for Section 2.2.
Downloads & Replication
Where a link is not yet available it is shown as unavailable rather than pointed somewhere plausible.
- Working paper (PDF)
- /papers/overnight-premium-indian-stocks.pdf
- SSRN
- Not yet available
- Code repository
- Not yet available
- Replication guide
- Not yet available
Questions about data, method or replication are welcome — see the contact page. The general approach to reproducibility is described under methodology.
Citation
Suggested citation
Subhash Sadacharam (2026). Overnight-Premium in Indian Stocks. Working Paper. Precision Capital Academy LLP. https://precisioncapitalacademy.com/research/overnight-premium-indian-stocks